Data
Below are high-level data outputs from the Global Food Systems Network Map. As Meridian continues to update the Network Map, these insights will reflect the latest findings.
The Data in the Global Food Systems Network Map
The Network Map includes a total of 94 multi-stakeholder initiatives (“Initiatives”), representing efforts across both terrestrial and aquatic food systems.
CAPTION: The percent of Initiatives whose work focuses primarily on aquatic, terrestrial, and both aquatic and terrestrial food systems.
The Topics that Multi-Stakeholder Initiatives Work On
The Global Food Systems Network Map visualizes the range of food systems Topic areas that Initiatives work on (see chart below). The Network Map can be used to identify Initiatives that focus on the same (or thematically similar) Topic areas. Organizations may find this information useful to identify potential partnerships.
CAPTION: The number of Initiatives associated with each Topic in the Network Map. Initiatives may work on more than one Topic. Note: Initiatives on the Network Map represent just a subset of all global efforts on food systems.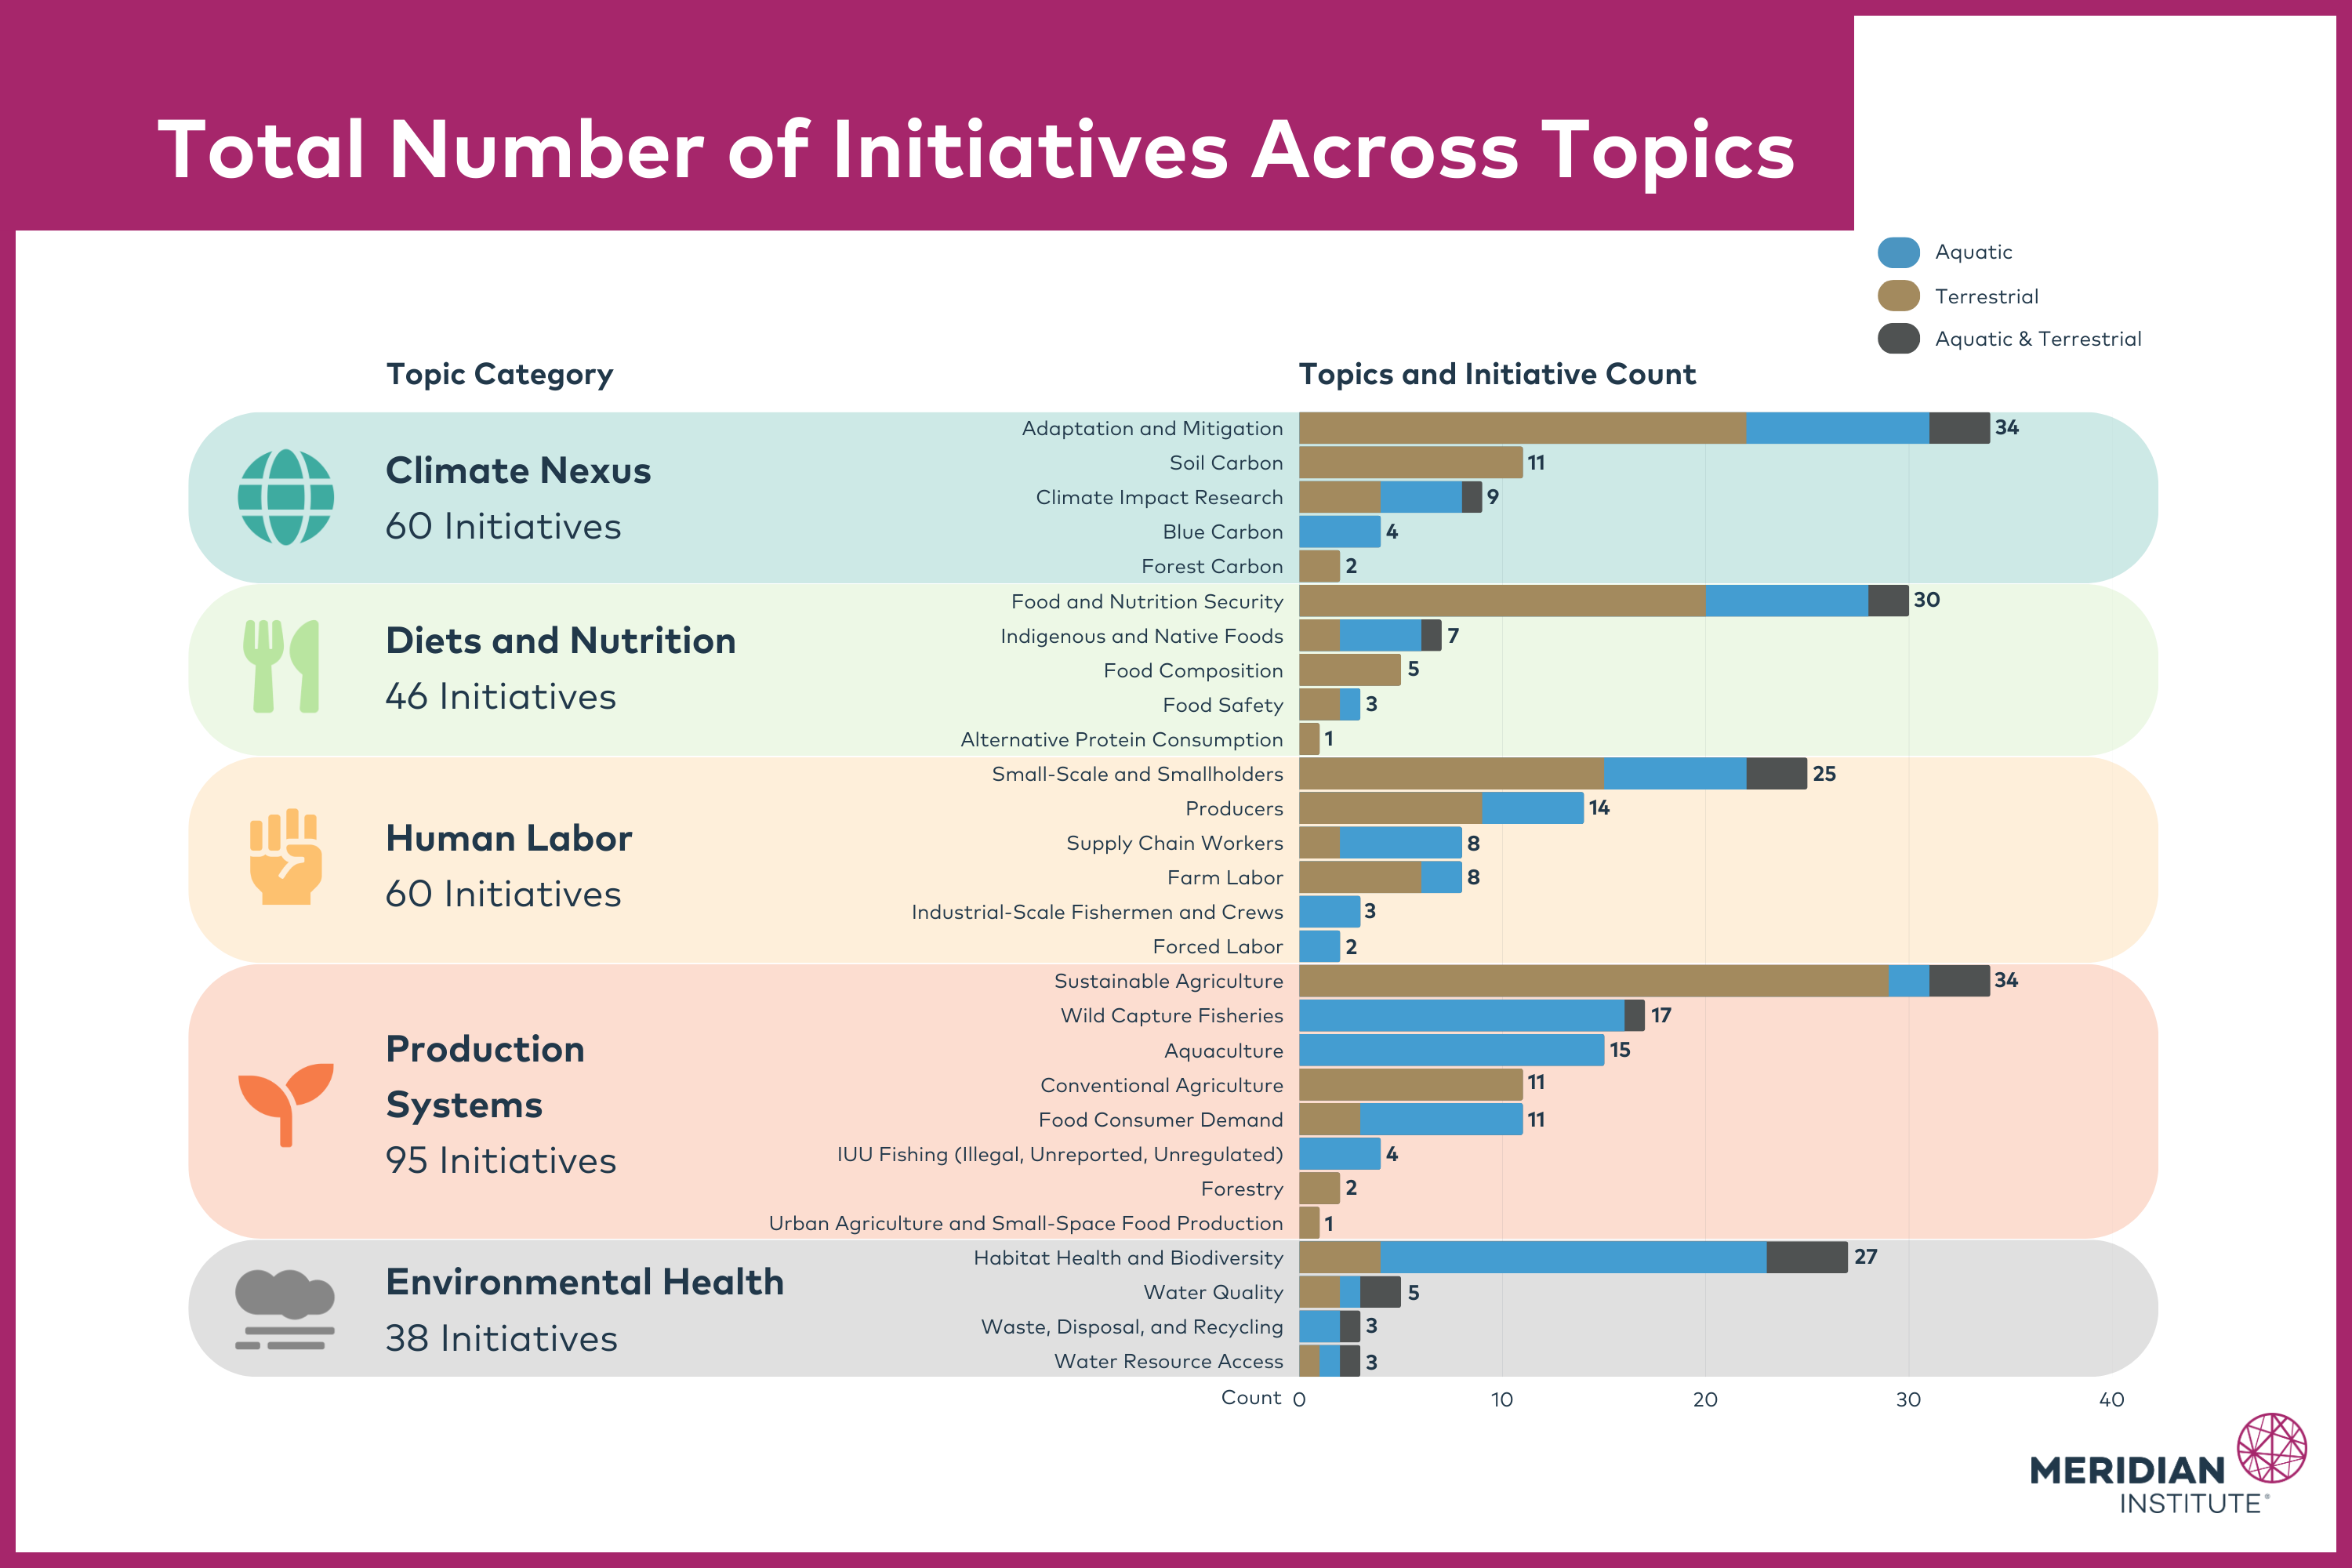
Based on our current dataset, Sustainable Agriculture, Adaptation and Mitigation, Food and Nutrition Security, Habitat Health and Biodiversity, and Small-Scale and Smallholder are the Topic areas that Initiatives most commonly work on. All these Topics, except for Sustainable Agriculture, apply to both terrestrial and aquatic food systems.
Alternative Protein Consumption, Forestry, Forest Carbon, Water Resource Management, and Forced Labor are the Topic areas that Initiatives least commonly work on. These findings may indicate gaps in our dataset or the fact that few multi-stakeholder efforts are currently working in these areas. If the latter is true, it is possible that food systems stakeholders see these Topics as less urgent relative to other areas, that funding for these Topics is more limited, or that these Topics are less resourced at the multi-stakeholder initiative level.
How Multi-Stakeholder Initiatives Are Driving Change
The Global Food Systems Network Map visualizes how Initiatives take action by linking each Initiative to one or more System Drivers. System Drivers are the mechanisms by which Initiatives drive change in food systems (see chart below).
The Network Map can be used to identify Initiatives that leverage the same (or thematically similar) System Drivers in their work. Organizations may find this information useful to identify potential partnerships and to identify potential gaps and opportunities in system interventions.
CAPTION: The number of Initiatives associated with each System Driver in the Network Map. Initiatives may be linked to one or more System Driver. Note: Initiatives on the Network Map represent just a subset of all global efforts on food systems.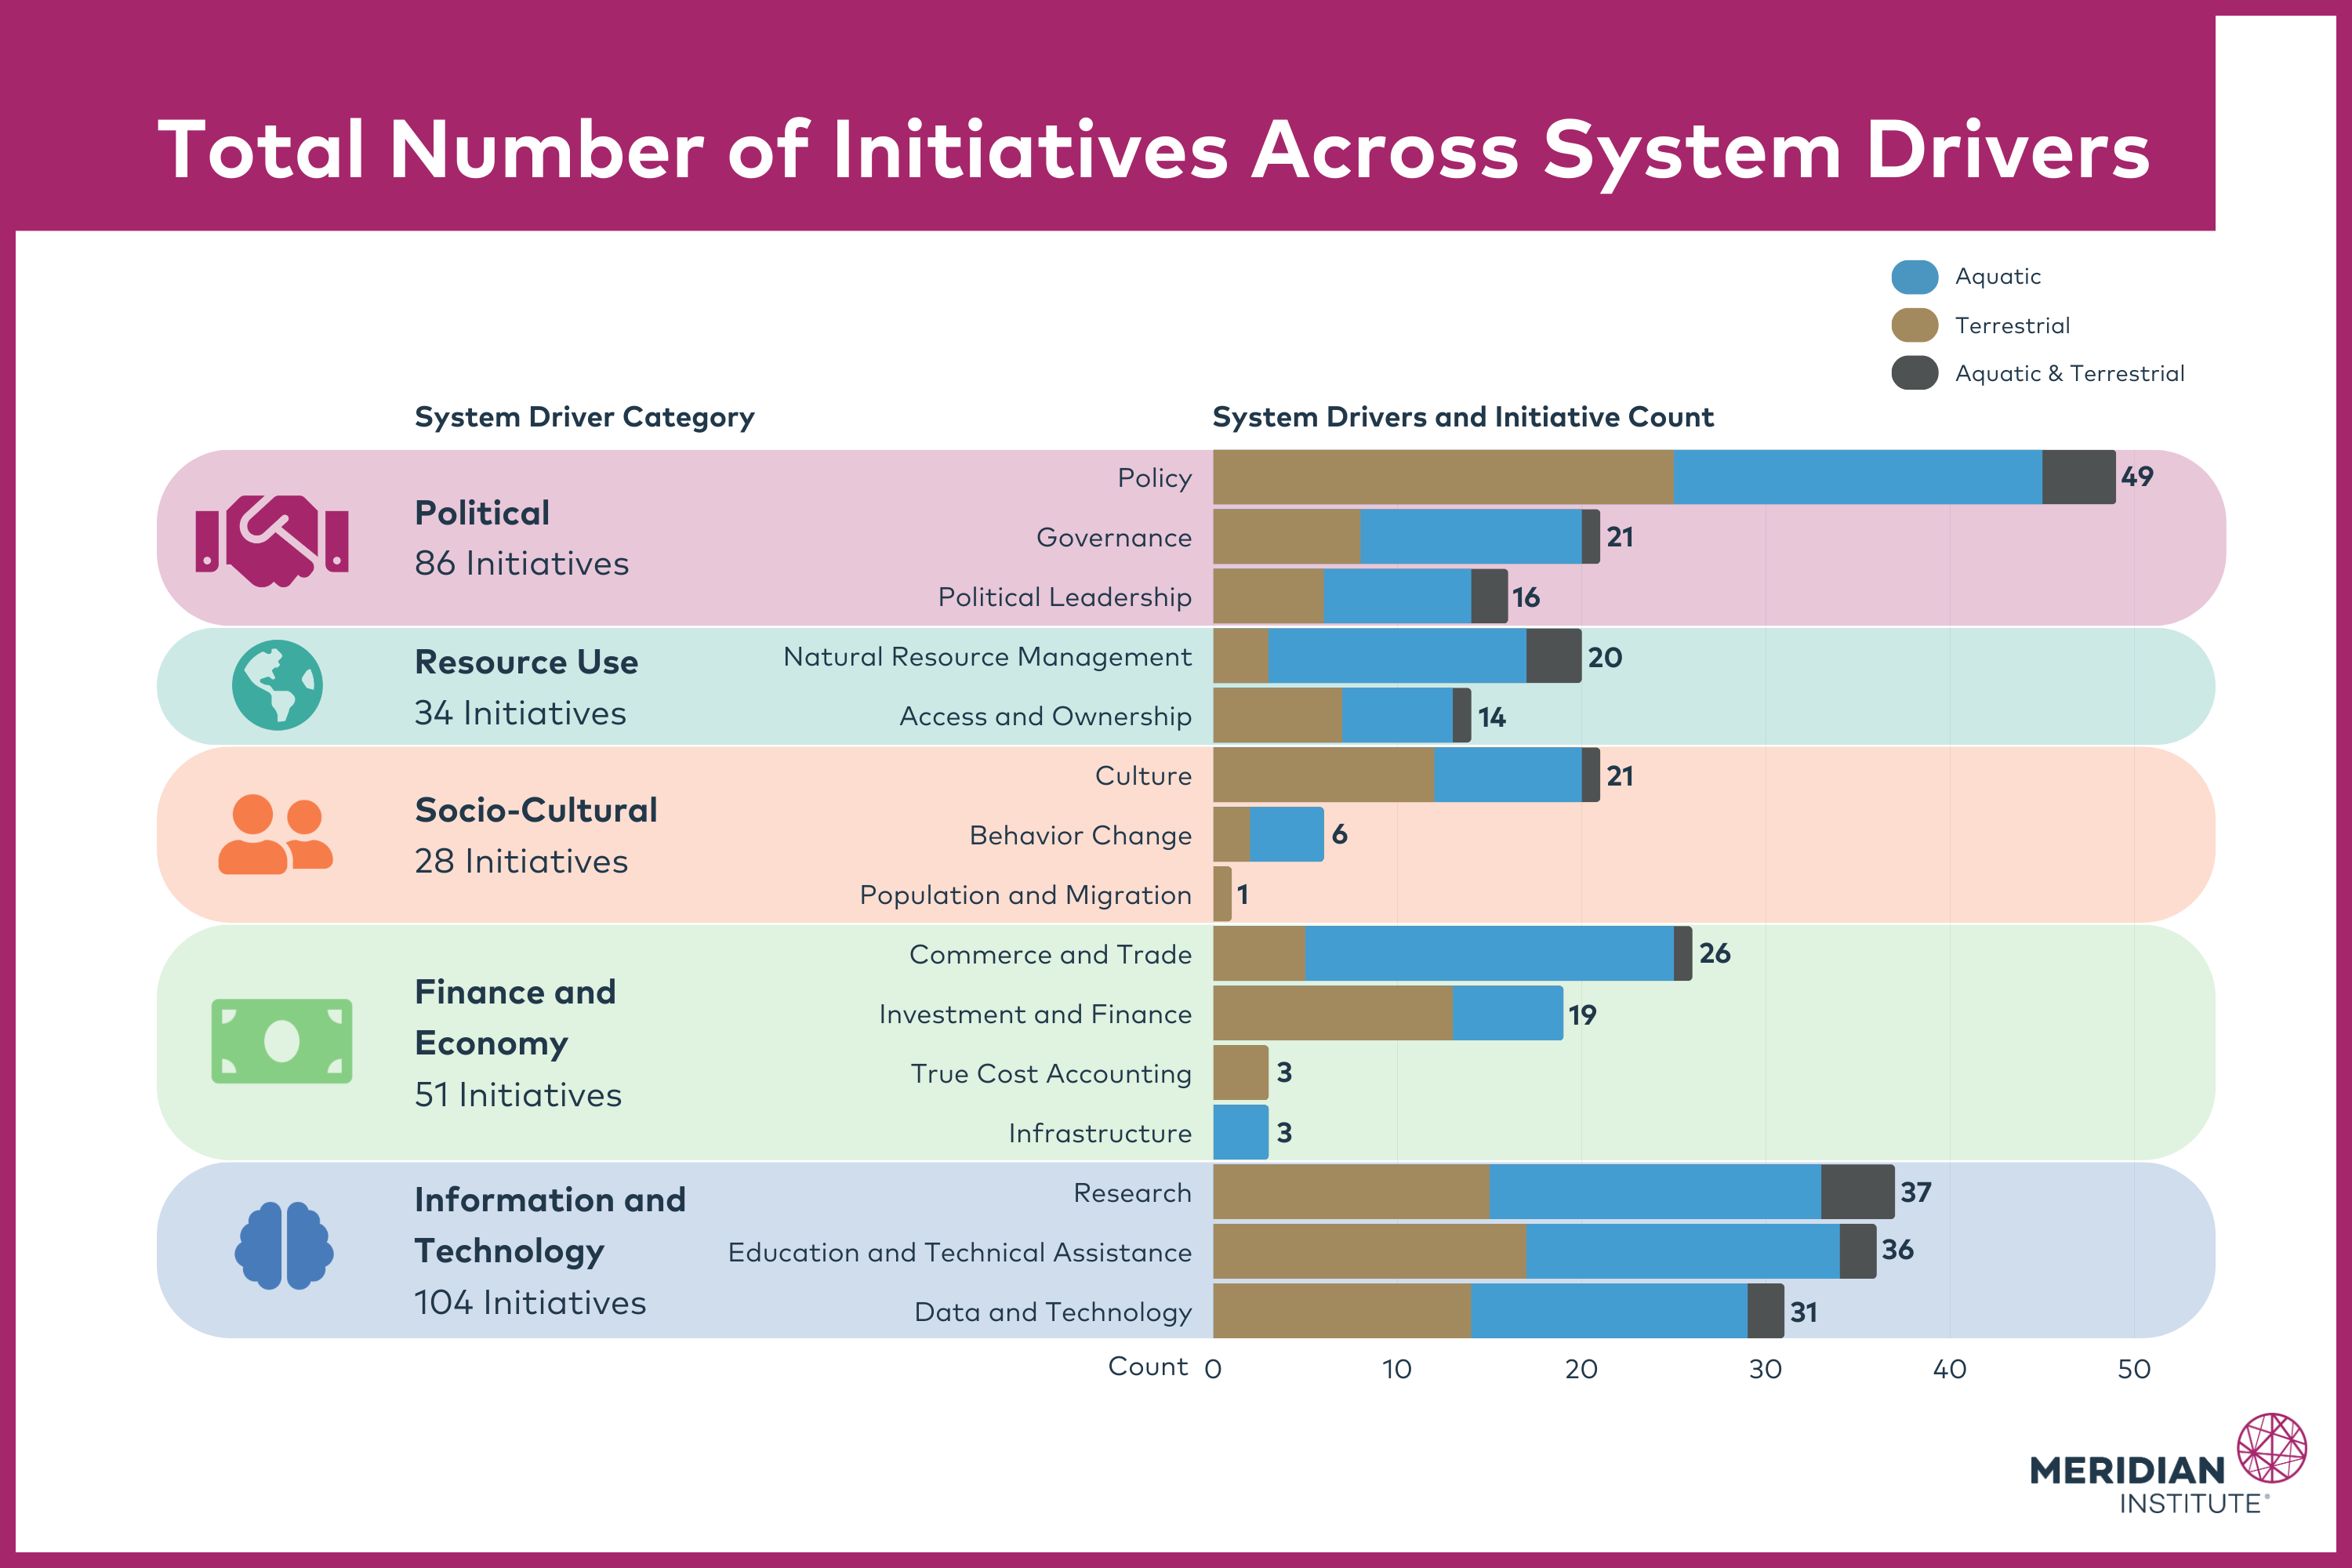
Based on our current dataset, Policy, Research, and Education and Technical Assistances are the System Drivers most leveraged by Initiatives. The System Drivers least leveraged by Initiatives in the Network Map are Population and Migration, True Cost Accounting, and Infrastructure.
Insights on Multi-Stakeholder Initiative Funding
Thirty-three Initiatives (35% of all Initiatives) disclosed information about their annual operating budget (see breakdown below).
CAPTION: The number and percent of Initiatives in the Network Map that disclosed information about their annual operating budget. Note: Initiatives on the Network Map represent just a subset of all global efforts on food systems.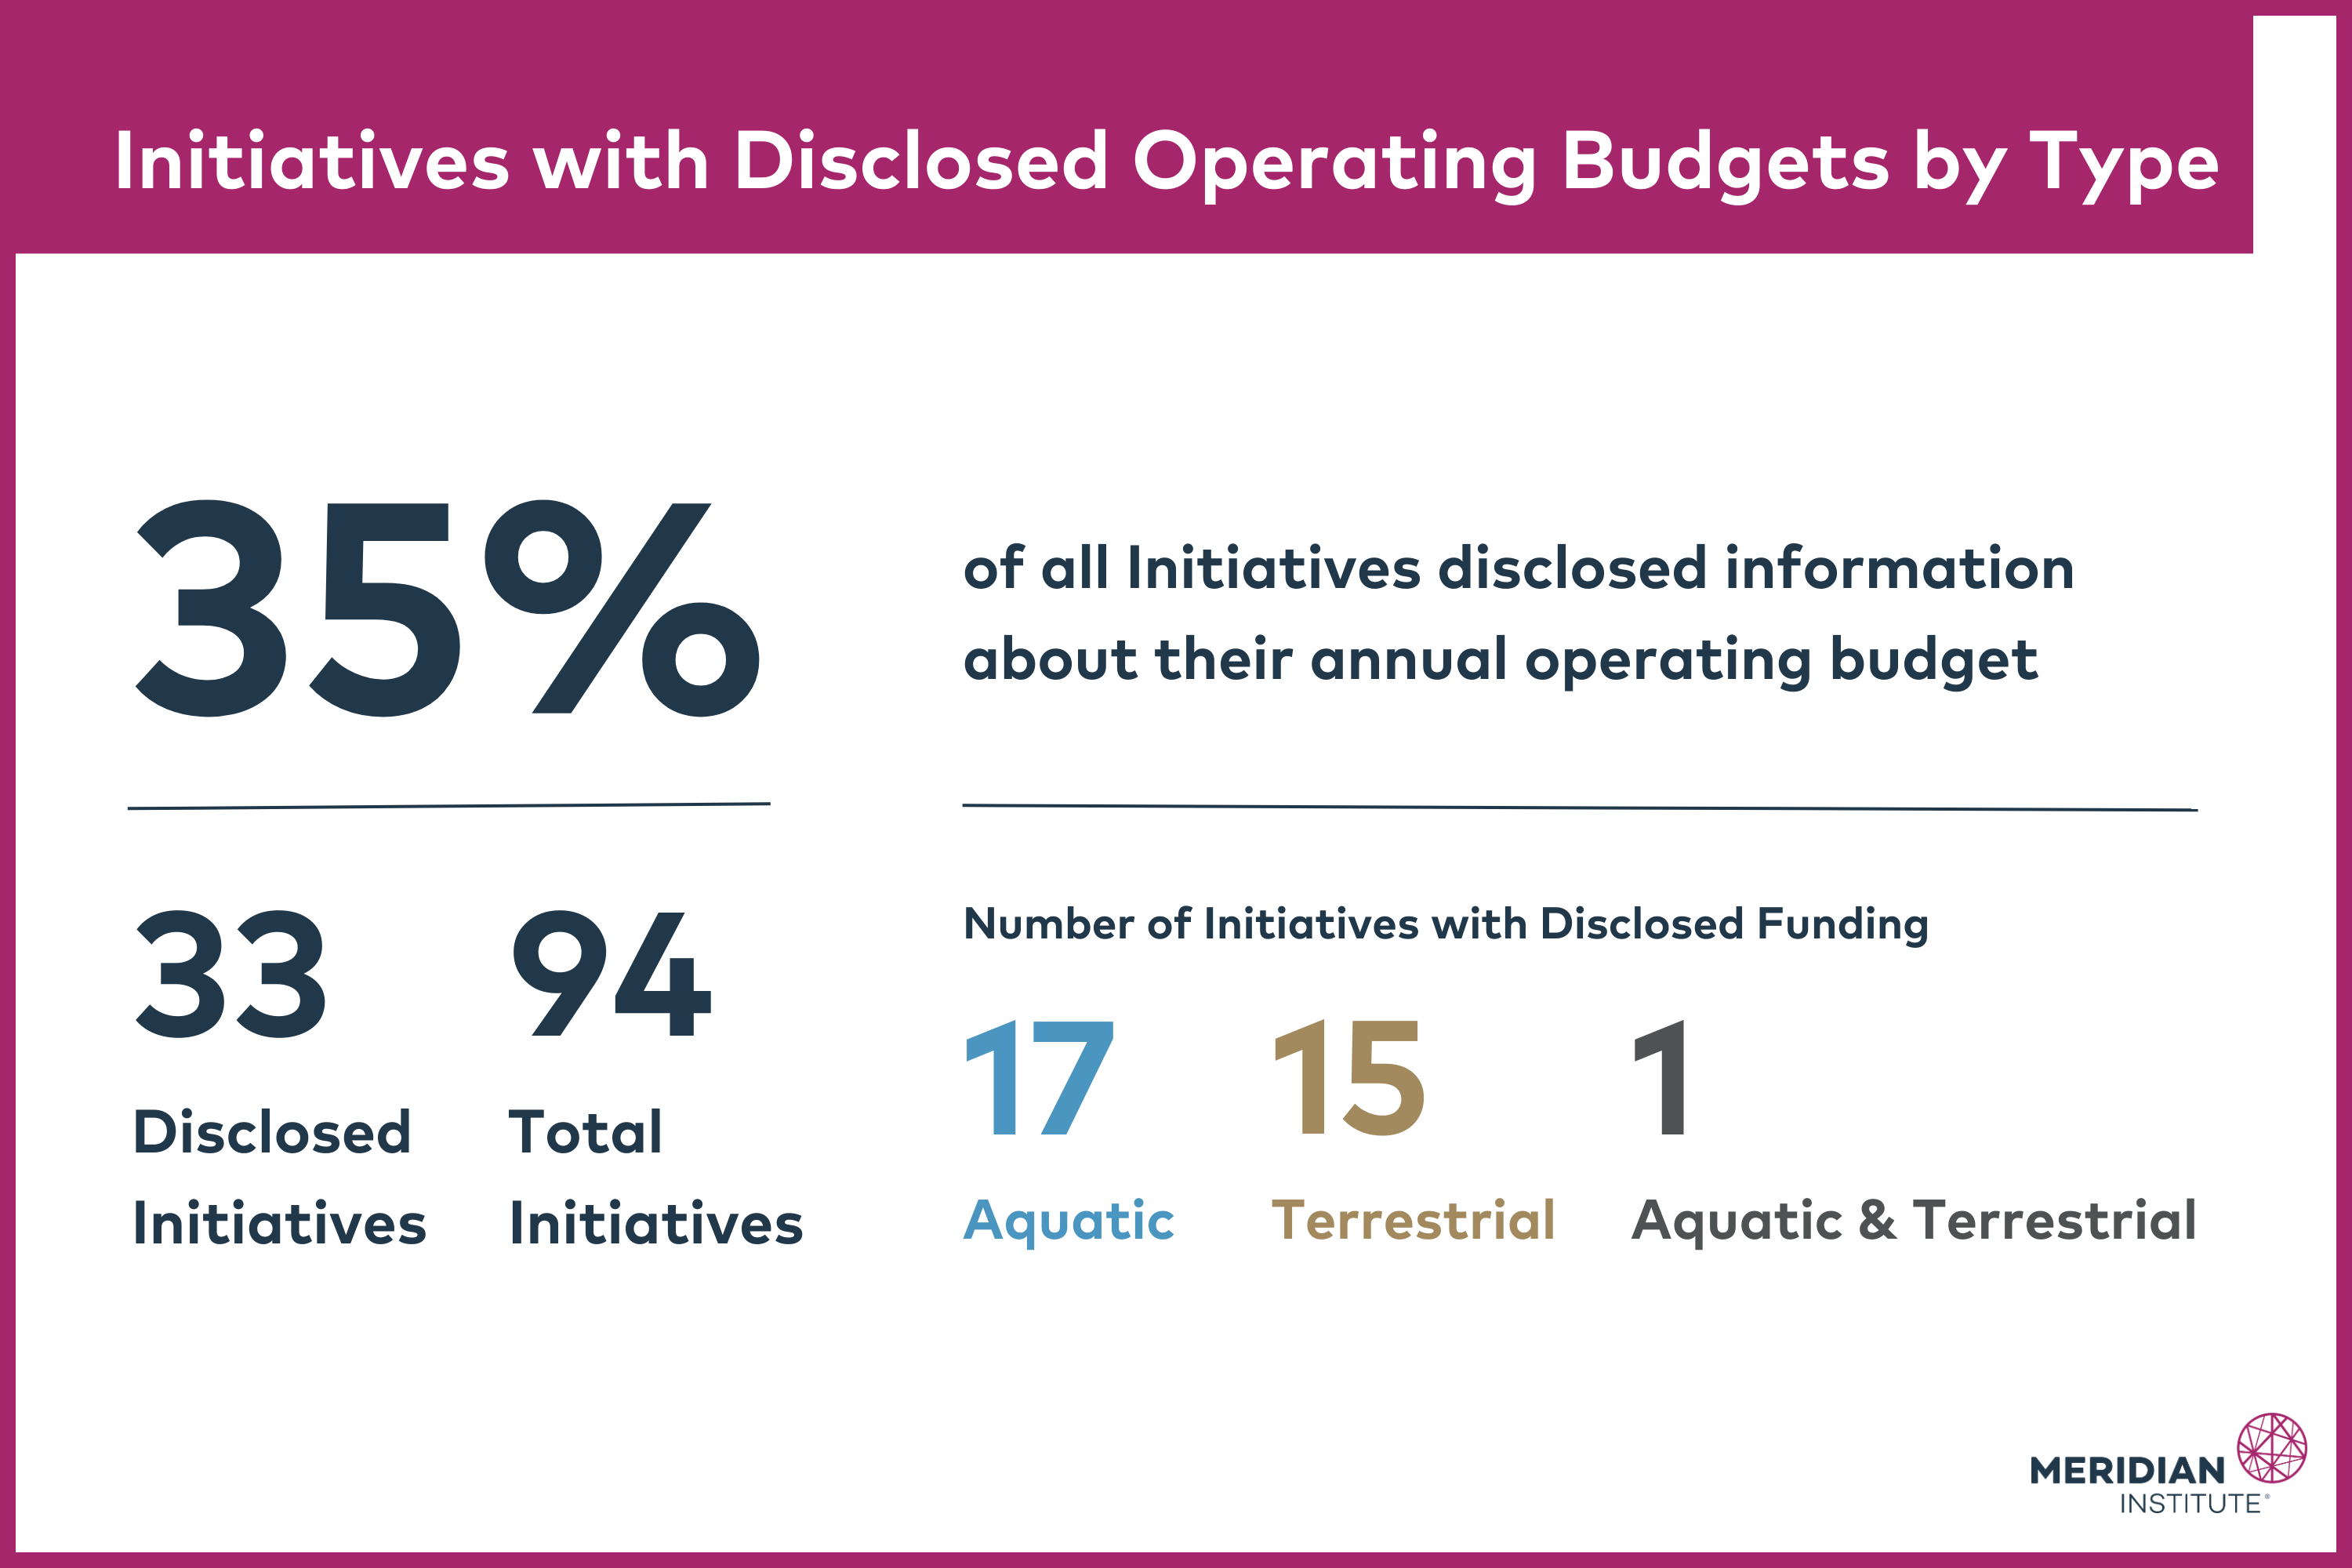
Based on our current dataset, Initiative operating budgets most commonly fell in the $100,000 to $500,000 (USD) and $1 million to $5 million (USD) brackets, each representing the budget levels for nine Initiatives.
CAPTION: Distribution of Initiative operating budgets by funding ranges and Initiative type, based on 33 datapoints. Note: Initiatives on the Network Map represent just a subset of all global efforts on food systems.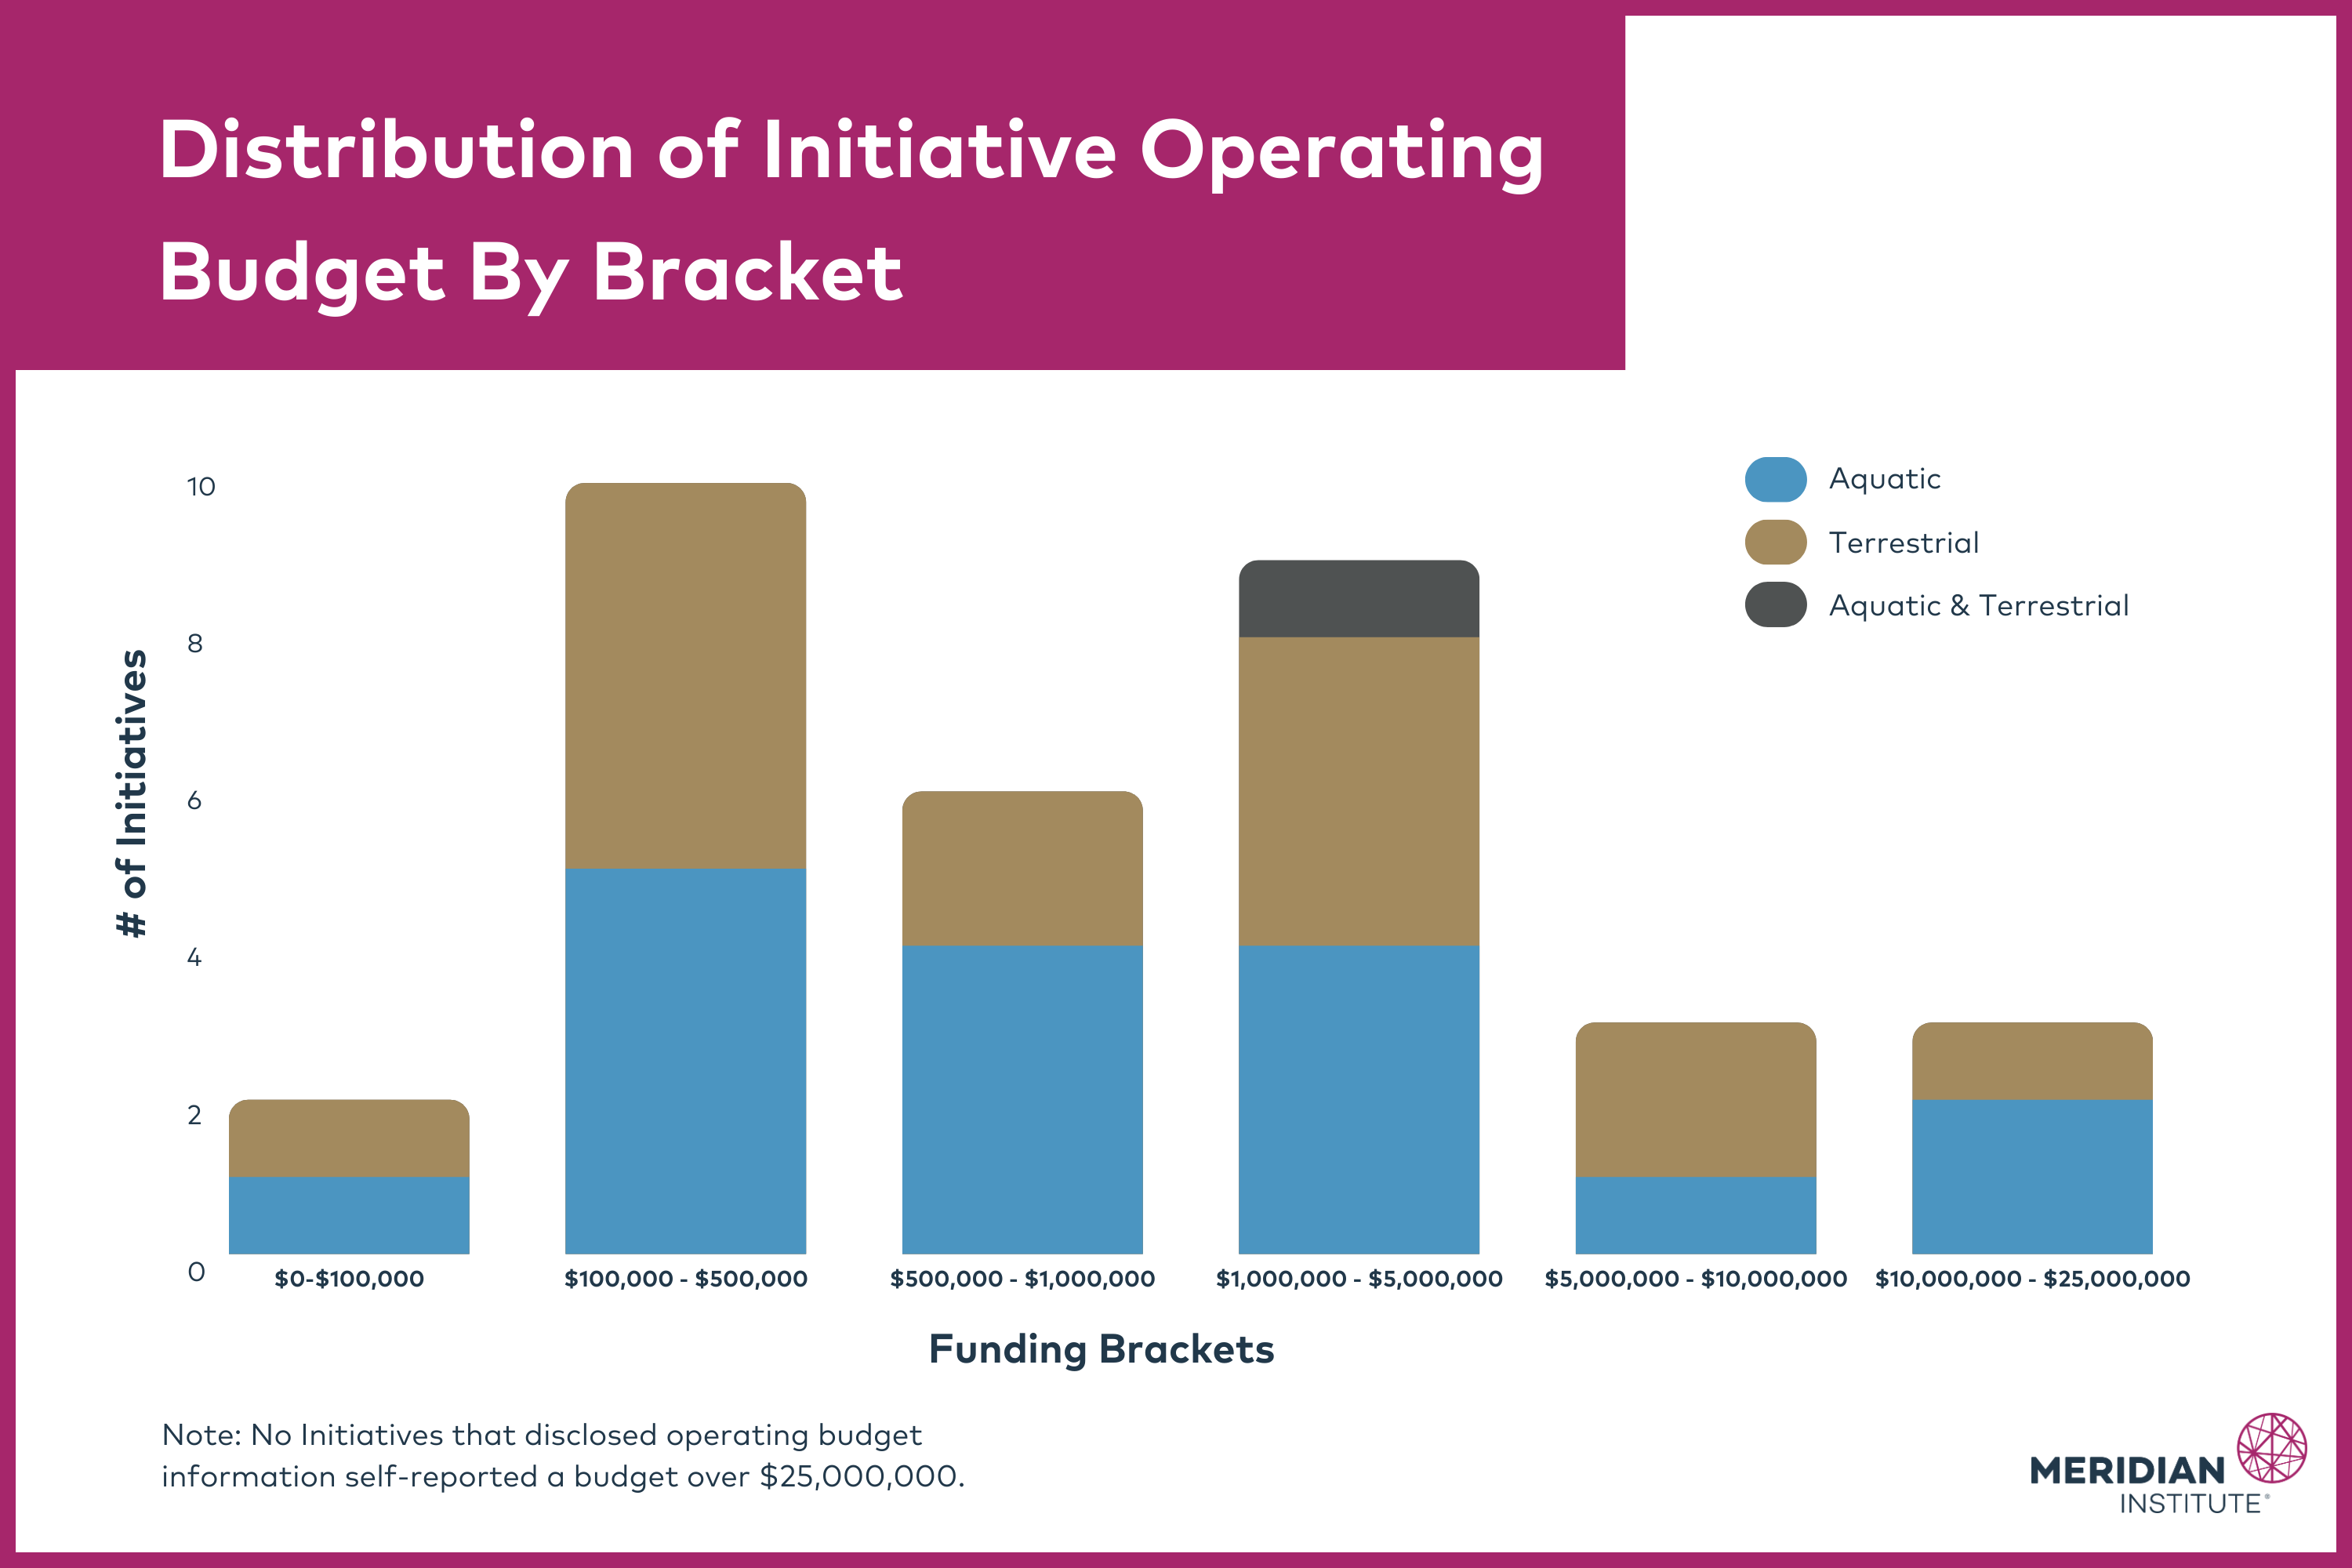
No determinations can be made at this time regarding differences in funding between terrestrial and aquatic Initiatives. As additional Initiatives provide operational budget information, Meridian will be able to more distinctly identify system trends.
Overall System Network Insights
Based on the analysis of our current dataset, the Global Food Systems network operates as a healthy and highly distributive network, where information is broadly shared, and no institution is operating as a “power hoarder.” As Meridian continues to update the Network Map, these findings may change.
Data Assumptions and Caveats
Meridian looks to update the Global Food Systems Network Map quarterly and identify key insights to support actions in the food system. These insights will be updated as we collect additional data and information.
It is important to note that Meridian’s Global Food Systems Network Map is not a traditional social network map, but rather a systems network map. Thus, it tracks connections among and between organizations based on activities they carry out and outcomes they focus on. This limits options for relationship-based social network analysis but opens up systemic insights on gap discovery and possible collaborations outside of known social circles. Generating analytics can provide insight into degrees of connectivity across the network, potential centers of influence, and the ways information may flow through the network.
Do you know of a multi-stakeholder initiative that you believe should be included in the Network Map? Please contact us — we’d love to hear from you!